How to use the git log graph and tree command

Git log graph example
One of the coolest features of the git log command is the graphing feature. The git log graph command creates a graphic overview of how a developer’s various development pipelines have branched and merged over time.
I find it especially impressive how this visual display is done through a decidedly non-visual BASH shell or terminal window. Let’s examine some more features of the git log graph command and how to use it in your code.
The git log graph command
In its simplest form, the git log graph command looks like this:
graph@log:~$ git log –graph
The git log graph command is too verbose without a pretty switch.
The problem with the basic –graph usage is that the log’s wordiness gets in the way. Instead, match the git log graph command with a pretty one line option to make the output look much nicer:
graph@log:~$ git log –graph pretty=online
Developers can also condense this line by dropping the pretty switch:
graph@log:~$ git log –graph –online
Both options greatly improve the readability of the git log graph, and also allow for created and merged branches over time to be displayed pleasantly.
Graph all git branches
Developers can see all branches in the graph with the –all switch. Also, in most situations, the –decorate switch will provide all the supplemental information in a formatted and nicely color-coded way.
graph@log:~$ git log –all –decorate –oneline –graph
A developer can really get crazy with the way they format the git log, but these four switches together is all most Git users will ever need. You can think of the mnemonic a dog as a good way to remember this combo:
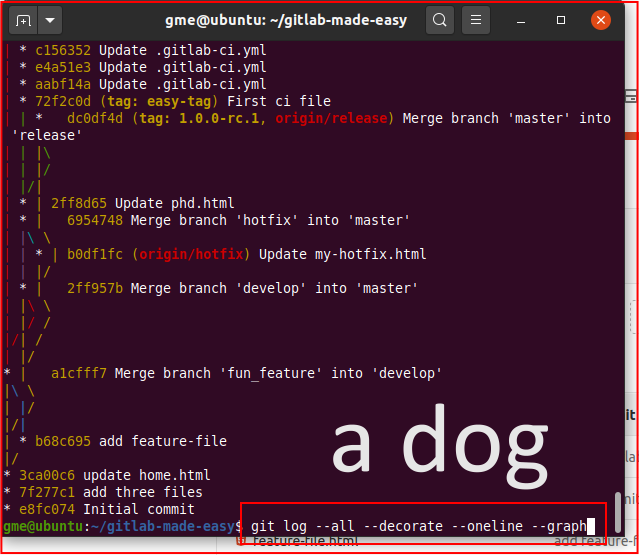
The Git log graph a dog mnemonic.
graph@log:~$ git log --all --decorate --oneline --graph
A pretty git log graph
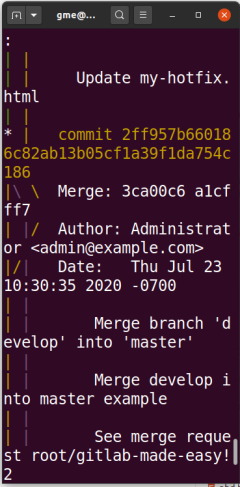
The pretty switch of the git log provides a multitude of ways to format git log output, especially when a developer uses the custom string. For example, if a developer provides the string %ad as the parameter to the pretty switch, they will see the git log graph with nothing but commit dates next to the branch and merge points.
The %h string will display nothing but a short commit hash, and %s will display nothing but the commit message next to the git log graphs’ commit points.
graph@log:~$ git log –graph –pretty=”%h” –date=short
graph@log:~$ git log –graph –pretty=”%s” –date=human
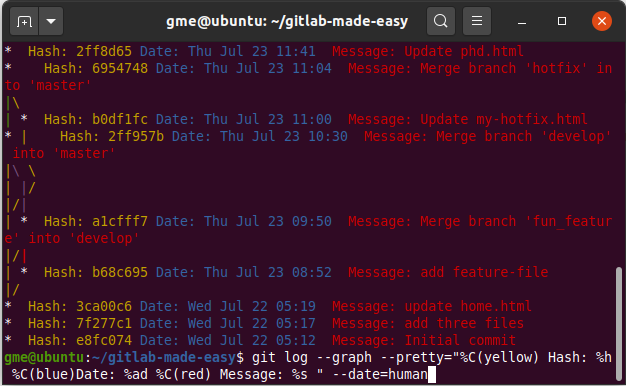
If you wanted to get real crazy you could even start coloring coding the display with a git log graph call like the one that follows:
git log --graph --pretty="%C(yellow) Hash: %h %C(blue)Date: %ad %C(red) Message: %s " --date=human
Combine the pretty option and a custom string with git log graph
Who let the dogs out?🐶
git log –all –decorate –oneline –graph
It's a mnemomic. A-D-O-G 🤣
Now when you speak about me, say nice things.🙏https://t.co/pWN735jyck
— Cameron McKenzie | Docker | GitHub | AWS | Java (@cameronmcnz) February 27, 2024
Git log graph examples
The following images show the git log graph output for these commands:
-
git log --graph --pretty="%ad" --date=short
-
git log --graph --pretty="%C(yellow) %s"
-
git log --graph --pretty="%C(bold green) %(ar)"
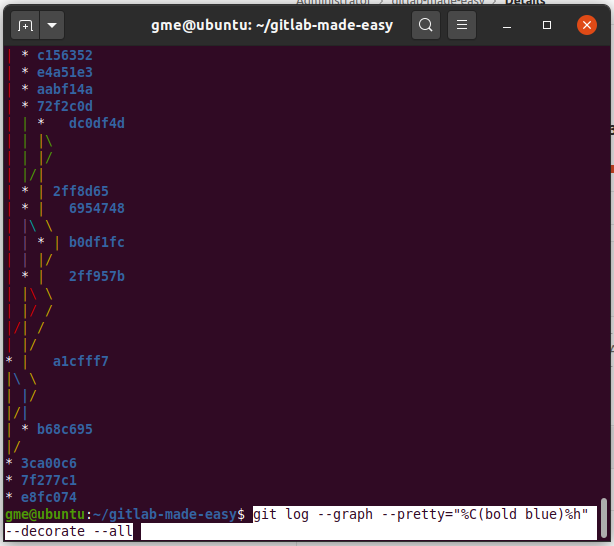
-
git log --graph --pretty="%C(bold blue)%h" --decorate --all
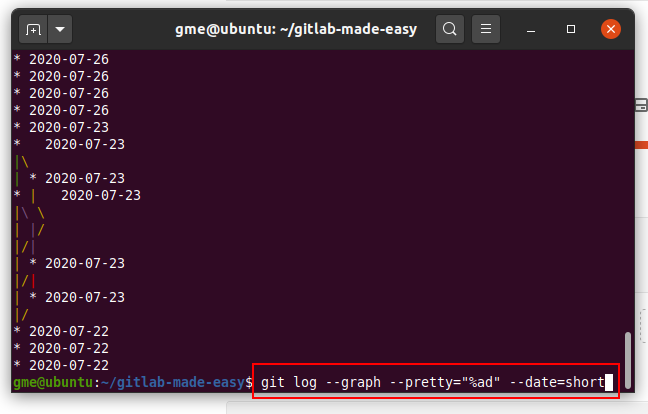
Git log graph with just the date showing.
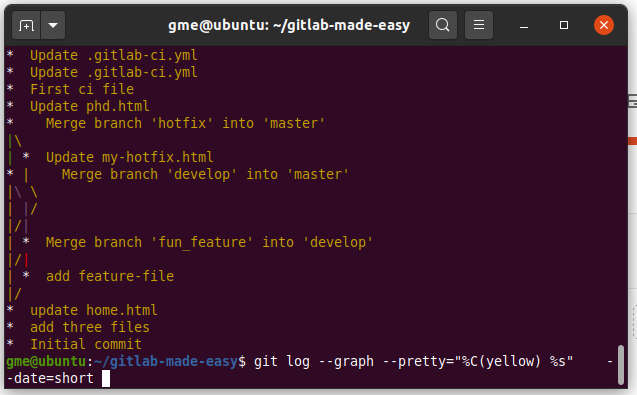
Change the color of the git log graph output to yellow.
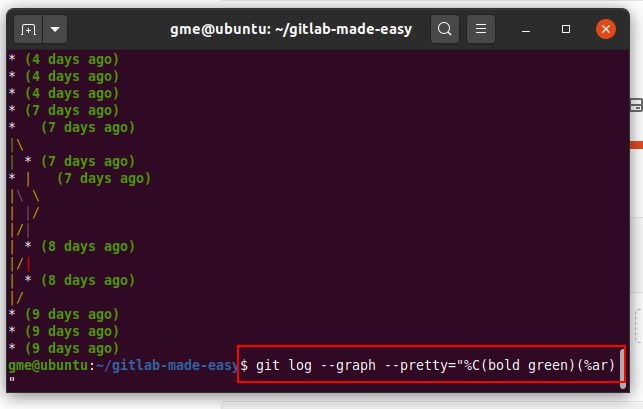
Use the pretty %ar switch with git log graph pretty.