SonarQube code coverage tutorial for beginners
Most software defects follow predictable and detectable patterns at the source code level. That's why continuous inspection with a code coverage tool is an absolute must for development teams that value code quality, security and maintainability.
What is SonarQube?
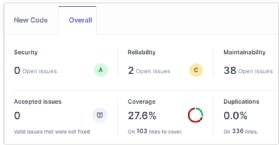
SonarQube, originally known as simply Sonar, is an open source tool that can inspect both the source code and the compiled code of over 20 different languages, including Java, JavaScript, Swift, Kotlin, Mojo and Python. SonarQube can then classify code coverage inspection results into the following seven categories:
- Code complexity.
- Security.
- Maintainability.
- Reliability.
- Test coverage.
- Code duplications.
- Documentation.
SonarQube tutorial
In this SonarQube code coverage tutorial, you will quickly learn how to perform the following tasks:
- Install SonarQube on a Linux or Windows machine.
- Use the SonarQube scanner to inspect Java code created in an Eclipse project.
- Integrate SonarQube and Maven together.
- Continuously inspect code pulled from GitHub with SonarQube.
- Call SonarQube from a Jenkins pipeline.
- Mark bugs as false positives or low-priority items.
- Assign defects to developers on your team.
This walkthrough is the first step in becoming an expert in continuous inspection with SonarQube's Community edition.
Cameron McKenzie has been a Java EE software engineer for 20 years. His current specialties include Agile development; DevOps; Spring; and container-based technologies such as Docker, Swarm and Kubernetes.