Code Analysis with the Eclipse Profiler
In my experience as a software professional, I often have the need to analyse an existing body of code in order to understand it. Everyone tries his or her best to create adequate documentation but it's a rare thing to find a fully documented component that needs no further explanation. This document describes an analysis technique using the Eclipse Profiler.
Overview
In my experience as a software professional, I often have the need to analyse an existing body of code in order to understand it. Everyone tries his or her best to create adequate documentation but it’s a rare thing to find a fully documented component that needs no further explanation. Hence, there comes a time when its necessary to put on the miner’s lamp and clamber through a pile of code and try to understand it.
There are a number of techniques that help this process, such as the forwards-and-back navigation provided by IDEs like Eclipse, but when there’s a lot of code to analyse then source-code-only analysis can be very difficult to visualise, very error-prone and downright time-consuming. Furthermore, OO code frequently abstracts in a way that confuses the analyst; polymorphism, dynamic data, remote method calls and auto-generated code to name but a few obstacles. Hence, when a recent project confronted me with code dozens of function calls deep, I was prompted to look for something that would assist this analysis process and not bust the budget. Fortunately there is a free plug-in for Eclipse that does a grand job.
This document describes an analysis technique using the Eclipse Profiler that:
- eases the process of analysing large amounts of code
- is free
- flattens out OO design and resolves runtime class loading, showing what code actually ran at a particular moment in time
- creates a graph of the call stack
- syncs the call graph with source code so you can navigate the code using the graph as a navigational aid
- allows you to save and re-load analysis information
- is self-documenting, providing a view of the code at the point of execution rather than a view created the last time the documentation was updated
- thins out un-important information in the code such as getters and setters
- is derived from an open source project, allowing you to tailor the source
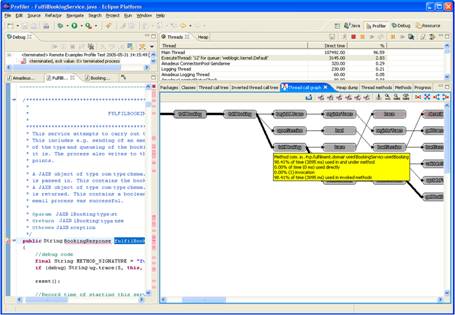
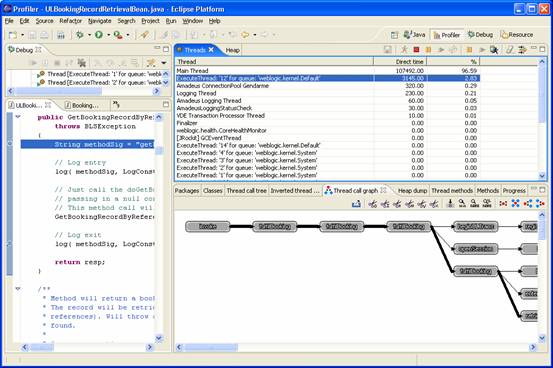
A snapshot of the profiler in action, displaying a call graph and associated code is shown below:
Figure 1: The Eclipse Profiler in Action
Profiling Background
Profiling is a technique used to capture information about the execution of code at runtime. In the Java world, profiling is achieved by tweaking the VM so that it runs a profiling agent. The profiling agent spits out information about what methods are being calling and when. This then allows a profiling client to connect to the profiler agent via a socket, capture the profile information and analyse it. I have not included a full description here, but an excellent introduction to Java profiling can be found at: http://www.javalobby.org/articles/jvmpi/
In Java 2, the JVMPI API was introduced to standardise the delivery of profiling information: http://java.sun.com/j2se/1.3/docs/guide/jvmpi/jvmpi.html
As of JDK1.5, a new API has been introduced called JVMTI: http://java.sun.com/developer/technicalArticles/Programming/jvmpitransition/
The Eclipse Profiler
The Eclipse Profiler (also called the Eclipse Colourer) is a free plug-in for the Eclipse IDE that captures and displays JVMPI-generated profiling information. The Profiler was written by Konstantin Scheglov and is available as an open source project from Sourceforge: http://sourceforge.net/projects/eclipsecolorer
In order to use the Profiler, you will need to be running Eclipse on one of the supported platforms.
Installation of the Eclipse Profiler
The first step you will need to perform is to download and install the Profiler. You can download the latest version of the Profiler at: http://sourceforge.net/project/showfiles.php?group_id=48823&package_id=71547&release_id=286446
I have followed the installation for Win32 using Weblogic8.1 with Eclipse 3.0.1 and found that the instructions online worked out-of-the box. If you are using a different platform, you will need to follow the relevant instructions carefully and browse the web to tap into other people’s experiences to get the Profiler running; if you get stuck, you can always try mailing the developers.
Install the Plug-in
Open up the downloaded Jar file and open the readme file. Follow the instructions and unzip the plug-in into Eclipse.
Install the DLL
Follow the online instructions to install the Profiler DLL: http://eclipsecolorer.sourceforge.net/index_profiler.html
On my installation of Weblogic 8.1, I copied the ProfilerDLL.dll file into D:beajrockit81sp3_142_04jrebin
Testing the plug-in
Eclipse should now have an additional Profiling perspective. Test the plug-in installation by starting up Eclipse and selecting:
Window->Open Perspective->Other…
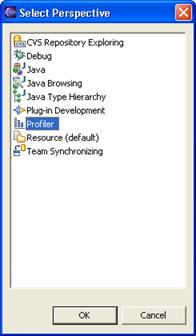
You should now see the Profiler perspective in the list of available perspectives:
Select the Profiler Perspective
Select the Profiler perspective. The perspective will open and you should see a number of new views:
The Profiler Perspective
The windows that are of interest to us are:
- The threads window. Active threads in the VM being profiled are displayed here
- The thread call graph window. The call graph is displayed and can be navigated here
- The source-editing window. Source is synched with the nodes selected in the Thread Call Graph window
- The Debug window. The debugger’s threads and the profiling process are shown here
If this is the first time that you have run the profiler then the threads and call graph window will be blank.
Setting up the Weblogic Project
Profiling needs to be configured for the VM that will be running the application. This requires:
- A working build of your application
- Configuration of the VM to invoke the profiler on startup
Creating a Working Build
Create a working build of your application. Make sure that you clean any old class files and that you have source code that matches your compiled classes.
Configuring the VM Startup Options
You will need to modify the Weblogic start-up script to invoke the profiling. Find the start script for your Weblogic application. Find and modify the line in this file that sets the JAVA_OPTIONS so that the profiler options are included; my JAVA_OPTIONS look like:
set JAVA_OPTIONS=%JAVA_OPTIONS% -Dtpfadaptor.weblogic.Name=SMPD289-BLS1 -Dtpfadaptor.weblogic.Domain=QVDEVBLS001 -XrunProfilerDLL:1 -Xbootclasspath/a:jakarta-regexp.jar;profiler_trace.jar;commons-lang.jar -D__PROFILER_PACKAGE_FILTER=__A__weblogic.Server;__M__sun.;__M__com.sun.;__M__java.;__M__javax.;__M__weblogic. -D__PROFILER_TIMING_METHOD=1
Deploy the Profiler Libraries
Copy the files commons-lang.jar, jakarta-regexp.jar and profiler_trace.jar from the downloaded Jar file into the top-level directory of the application that you are profiling.
Capturing Profiling Information
Capturing the profiling information is best achieved by using both the Profiler and the remote debugger together. Using the remote debugger is useful, because the profiler emits a continuous stream of profiling information and it is sometimes difficult to follow this information in real-time. The debugger allows you to freeze the code at a predetermined point and examine the profiling information at your leisure.
The call graph generated by the Profiler will show you the call stack within a specific thread. Hence, to capture profiling information for a specific area of code:
- Choose the top level method in the application that you want to base the call stack on
- Set breakpoints at the entry and the exit of this method
- Run the application until the first breakpoint has been hit
- Continue execution of the application until the second breakpoint has been hit
- Open the profiler and view the profiling information
- Save the profile information
Setting up the Remote Debugger Configuration
Details explaining the configuration of the remote debugger can be found elsewhere and are not included here. However, ensure that there is a working remote debugger configuration setup within Eclipse before proceeding further.
An article explaining the Eclipse Remote Debugger can be found here: http://linuxdevices.com/articles/AT6046208714.html
Setting up the Profiler Configuration
Setting up the Profiler configuration in Eclipse is very similar to the process used to setup the remote debugger.
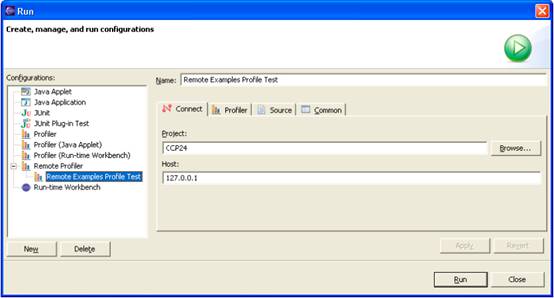
Select the Run->Run menu. The run configuration window appears:
Create a New Profile
In the Configurations window on the left, you will see some profile configuration options. Right-click the one entitled ‘Remote Profiler’ and select ‘New’.
Enter a name for the profiling configuration; this will be the name that is used to name profiling files that you save.
Ensure that the ‘Project’ setting is the same as the ‘Project’ setting used by the remote debugger configuration and that the host setting is correct.
Select the Profiler tab:
The Profiler Tab
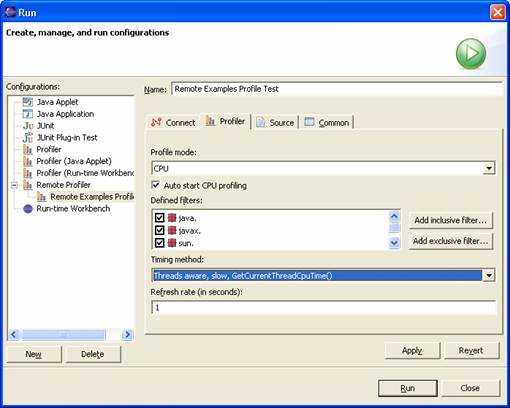
Ensure that the ‘Profile Mode’ setting is set to CPU, the ‘Timing Method’ is set to ‘Treads aware, slow, GetCurrentThreadCpuTime()’ and that the ‘Refresh Rate’ is set to 1.
Click ‘Apply’ and then ‘Close’ – do not connect the Profiler yet.
Starting Weblogic
! Using the profiler will slow down the application by an order of magnitude. It is therefore recommended that system usage be reduced to a minimum before starting Weblogic e.g. by stopping any antivirus checking.
Start your application using the start-up script. Double-check that the JAVA_OPTIONS and JAVA_HOME values are correct and that both the debug agent and profiler agent are being invoked by the start-up script; if your start-up script does not echo out these values then edit the script to echo these values and restart.
Connecting the Remote Debugger and Setting Breakpoints
Once Weblogic has started, start the remote debugger in Eclipse by selecting Run->Debug… and then selecting the correct configuration.
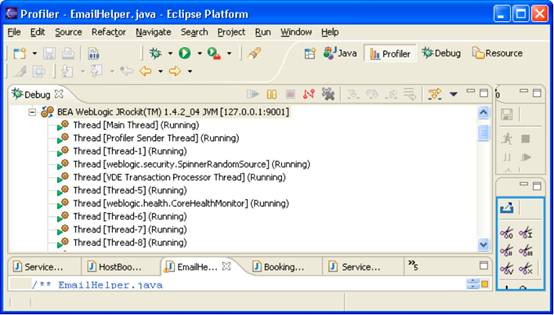
Ensure that the remote debugger has connected to Weblogic correctly. If the Debug profile is not open then open it; the Debug window should show the active threads within the Weblogic VM. If you don’t see this, double check that Weblogic was started with the correct debug options and that the remote debugger is pointing at the correct server.
The Debug Window
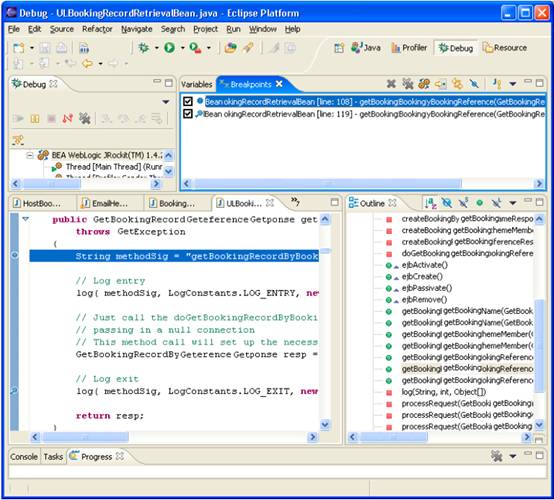
Using the source window, find the function that will be the top of the call stack that you wish to analyse and set breakpoints at the start and end of this function.
The Source Window
Drive the Application
Using the web interface, a test harness or another method of choice, drive the application until the first breakpoint has been hit. Note that the first breakpoint is just a sanity check so you can verify that the code you expect is about to be executed; you can miss this step if necessary.
Press the continue button on the top of the Debug window (the green ‘Play’ arrow ![]() ). The application will continue and will break at the second breakpoint. Leave the application paused on the second breakpoint.
). The application will continue and will break at the second breakpoint. Leave the application paused on the second breakpoint.
Connecting the Profiler
Notice that the profiler has not been connected to the application yet. Profiling information up to this point will have been ignored. Displaying the profile information in real-time increases the load on Eclipse, so leaving the Profiler disconnected until needed will increase performance.
Select Run->Run… and then select the Profiling configuration created earlier. Click Run . The Profiler will connect to Weblogic.
If the Profiler perspective is not already visible, select it now by choosing Window->Open Perspective->Other… and selecting the Profiler perspective. The Profiler perspective should now be visible, but there will probably not be any data visible yet.
In the Debug window, scroll to the bottom and select the profiler session; the threads window in the profiler should now fill with information. If the profiler session is not visible then double check that Weblogic started with the correct profiling options and that the Profiler is pointing at the correct server.
The Threads Window
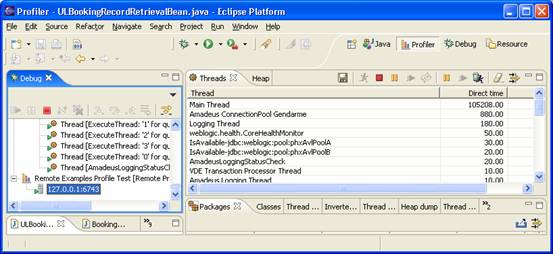
Display the Call Graph
The threads window displays all the active threads in the VM running the profiler. Many of these threads will be Weblogic’s internal processes pottering around and will not be of interest. The threads that execute the Weblogic application code will have a name of the kind:
ExecuteThread: ‘12’ for queue: ‘weblogic.kernel.default’
By default, the threads are listed in order of the amount of time spent executing code within them. Application threads will generally be near the top of this list. Select the topmost thread with a name similar to the one listed above.
Select the Thread Call Graph; a call graph for this thread will appear.
The Call Graph
The Thread Call Graph shows the methods executed. Ensure that the nodes correspond to the code that you wish to analyse. If you cannot see a node from the code in question, try selecting a different thread and check the Thread Call Graph again. Once you have found the correct thread, you are ready to analyse the code behind it.
Analysing the Code
You should now have a call graph of the code that you wish to analyse. The following are techniques that you can use to utilise the graph and explore the code.
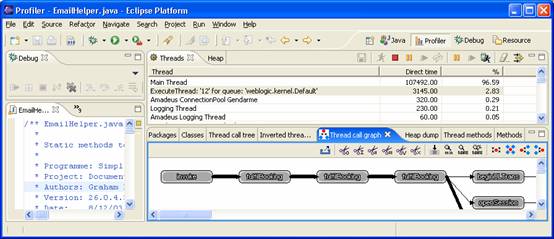
The Thread Call Graph
An example Thread Call Graph is shown below; I have maximised the window:
Analysing the Call Graph
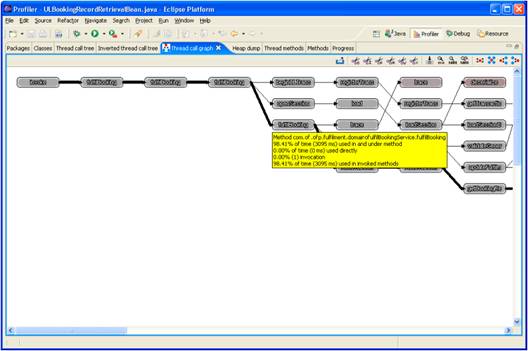
Each node in the call graph depicts a method in the call stack. The node itself contains the method name. The arrows joining the nodes depict calls between nodes; the thickness of the arrow approximately shows the amount of time spent in the called method. Note that the call stack will include methods in the call stack that are generated by Weblogic or other tools used by the application. There will therefore be stub and skeleton classes in the graph, which will not have accessible source code.
Basic Navigation in the Graph
Hovering the mouse over a particular node shows the package and the method name together with other profiling information.
To prune the tree so that only nodes from a certain point downwards are displayed:
- select the new top node
- click the
 button
To prune the tree so that only nodes above a certain point are displayed:
- select the new bottom node
- click the
 button
To display all nodes:
- click the
 button
Using just the Thread Call Graph, it is possible to scope out the scale and shape of a large block of code. Dependent packages can be identified, key methods and their relationships can be viewed and the call stack analysed rapidly and in detail. As a first-pass through a new component, I have found this to be very handy before focussing in on specific areas of detail.
Following the Code
You can follow the source code using the graph as a navigational aid. Double-clicking one of the nodes (for which there is source code) will display the source code for that node in the source code window.
You will notice that the profiler does not show every method in the call stack and selects the 200 most time-consuming methods. This is useful since it prevents simple calls like getters and setters from being depicted. Sometimes this is not so useful, as methods of interest might not be shown and it is necessary to use the source code window to view short-lived methods. It is therefore advisable to keep an eye on the source code window to ensure that you get a full view of the entire code. The Profiler source is on the web, so there’s always the opportunity to edit the code and change the threshold if you’re not happy with the 200 methods setting. You might also notice that a single call graph will not be able to display calls that are remote e.g. calls to EJBeans since these will execute in a different thread. Therefore you might notice that calls between components are not visible in the graph while they are clearly visible within the code. If you wish to see code on the other side of a remote call, you should repeat the process of capturing the profile information for the called component.
Using the Call Graph as a navigational aid to rummage around the code allows the code to be navigated rapidly via a high-level view. It also means that you do not need to remember the relationships between methods or generate your own diagrams, as you can simply use the graph for that purpose instead. I have found that this approach is much easier and quicker than using the basic features of Eclipse’s source editor to analyse code.
Saving and Loading Code
Once you have captured profiling data, you can save the data by clicking the Save icon. Data will be saved into a profiles directory under the root of the Eclipse project directory. Each profile will automatically be given a name that includes the timestamp and the project that originated the data.
! There is a glitch in the Profiler that causes Eclipse to hang if you use the Save function more than once. This means that if you wish to proceed and capture a second batch of profiling information after you have used and saved one set of profiling information, you should exit Eclipse and re-start.
To load a saved set of profiling information, Select File->Open External File… and then select the profiling file. The profiler perspective will open and display the saved session.
The ability to save and reload the profiling information is a valuable feature as it allows the same snapshot to be reused later or shared with other analysts.
Conclusion
This document described how to use the Eclipse Profiler to support the analysis of medium to large bodies of code. A process was described that creates a visual representation of the code as it executes and several techniques were described that allow you to use this captured profiling information to navigate through code rapidly.
The Profiler follows the tradition of quality, free Eclipse tools and I have found that it saves a considerable amount of time when presented with the often daunting task of digging into code and assimilating the meaning of it. I have found that the effect of ‘flattening’ the OO features of the code especially useful and the fact that the process is effectively self-documenting is also very appealing, since the overhead to use this form of analysis is very low. This approach is not intended to be a substitute for other methods of analysis but is a compliment to them, removing some of the most difficult and onerous aspects of code analysis.
The Profiler or Eclipse Colourer is an open-source project:
About the Author
Peter is an Application Architect working for a bluechip company in London. He is also founder and lead developer for www.jinjatech.co.uk, specialising in mobile application development. Peter has over 15 years experience in IT, specialising in Java and mobile. In his spare time, Peter is a keen musician and traveller. He has a wife and 18 month old daughter and lives in Edinburgh.