What is Java Flight Recorder and how does it work?

Java Flight Recorder is a Java Virtual Machine (JVM) profiler that gathers performance metrics without placing a significant load on resources. The profiler is intended to remain on continuously -- even in production systems -- so that an examinable event history will exist even if the virtual machine crashes.
Java Mission Control
Java Flight Recorder and its companion tool, Java Mission Control, were originally developed by Appeal Virtual Machines (AVM), a Swedish software company. AVM also developed JRockit, a VM that specialized in runtime performance and bytecode optimization. AVM was acquired by BEA systems in 2002 and then by Oracle in 2008.
A commercially licensed version of Java Flight Recorder was integrated into Oracle's HotSpot JVM in 2013 as part of an updated Java 7 release. It wasn't possible to attain unlicensed use of Java Mission Control and Java Flight Recorder in production environments until Oracle released these tools to the open source community in 2018. JDK 11 was the first long-term support release to include open source licensed versions of these tools.
Java Flight Recorder and JVM optimization
The original goal of Java Mission Control and Java Flight Recorder was to help develop and optimize the JRockit JVM. A developer could use the metrics gathered to better understand the following:
- how the JVM behaves at runtime;
- how the JVM allocates resources while under various loads;
- where bottlenecks are as bytecode is processed; and
- how and when just-in-time compilations are performed.
While the initial purpose of Java Flight Recorder was to provide insight into how the underlying JVM operated, it quickly became apparent that these metrics were also extremely valuable to software developers interested in examining application performance.
Java Flight Recorder optimizations
One drawback to many application profiling tools is that they can diminish runtime performance. Java Flight Recorder is designed to mitigate this concern. A developer can let it run continuously in the background, even on production systems.
One way that it reduces the runtime load is by operating internally within the JVM. Most JDK profiling tools require a developer to install additional components on the JVM, which then report metrics to an external data gathering tool. This "chattiness" between the JVM and an external monitoring tool can impact performance.
Java Flight Recorder further minimizes the harm to performance through the tabulation of data that is already maintained by the JVM, rather than implementing new mechanisms that track performance.
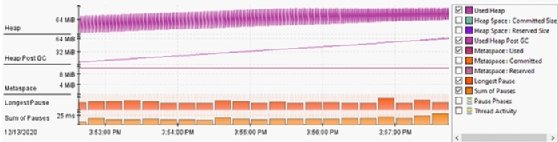
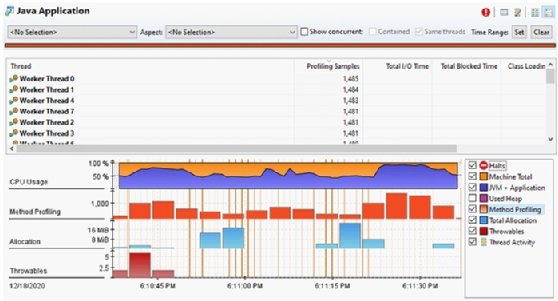
For example, every JVM keeps track of memory usage, active threads, heap size and garbage collection routines as part of its normal, ongoing runtime. Java Flight Recorder taps into these already calculated metrics and records them.
Learn more about Java Flight Recorder and Java Mission Control
Instrumentation vs. sampling
Java Flight Recorder also minimizes its runtime load by sampling data throughout the application lifecycle. It doesn't capture every single occurrence of a thread block or object creation. Instead, Java Flight Recorder randomly records metrics at irregular intervals.
While it might miss individual events, Java Flight Recorder will grab enough information over time to paint an accurate picture of how the JVM performs.
In terms of troubleshooting, application behavior over time is usually more meaningful than individual events. More importantly, sampling is far more efficient than low-level instrumentation. A default Java Flight Recorder configuration has less than a 1% performance impact on system resources, while extensive profiling is unlikely to exceed 2%.
Java Flight Recorder metrics
A developer can use some or all of the following Java Flight Recorder metrics to monitor applications and troubleshoot problems:
- Thread activity
- Object allocation
- Instance locks
- File and socket I/O
- Exception counts
- Garbage collection time
- Code cache and compilation
- TLAB allocations
- G1 heap layout
- VM operations
- Memory consumption
- Number of live objects
Continuous application profiling
Java Flight Recorder acts similarly to an airplane's black box. It's designed to always be on and records events leading up to an event.
For example, with continuous profiling enabled, when a JVM crashes, Java Flight Recorder will write all the data it holds in memory to the local filesystem. This feature allows a developer and DevOps team to examine the various execution patterns prior to the failure.
How to start Java Flight Recorder
Along with the continuous recording mode, a developer can also explicitly start Java Flight Recorder, have it run for a predetermined amount of time and subsequently inspect the recording.
A developer can also enable triggers within Java Mission Control. For example, an MBean that monitors CPU usage or memory consumption could trigger Java Flight Recorder to start if it exceeds an 80% utilization threshold.
The Java 14 release introduced the ability to stream Java Flight Recorder metrics for real-time profiling. Also, the JDK can run multiple Java Flight Recorder activities at the same time, which lets a developer simultaneously run various recording options.
Java Flight Recorder and Java Mission Control
Java Flight Recorder saves its data in a binary format. Data analysis requires an additional tool to parse the information. Java Mission Control is the de facto data visualization tool to use with Java Flight Recorder, although other tools -- such as VisualVM -- can read Java Flight Recorder files as well.
Also, since Java Mission Control is now open source, it's available from a variety of JDK vendors, such as:
- Azul
- Oracle
- Red Hat
- AdoptOpenJDK
- Eclipse Adoptium
Java Flight Recorder API
The Java Flight Recorder API makes it possible to parse, process and interpret data files in a highly customized manner. As a result, it's possible to make headless analysis of recordings.
Tools that use the JFR API to create flame graphs and method histograms are two popular examples of performance analysis tools that extend the capabilities of Java Flight Recorder and Java Mission Control.