Java Mission Control

What is Java Mission Control?
Java Mission Control is a performance-analysis tool that renders sampled Java Virtual Machine metrics in easy-to-understand graphs, tables, histograms, lists and charts. Originally designed to depict the lightweight sampling data acquired by the Java Flight Recorder profiling tool, the scope of Java Mission Control has expanded. The tool has grown into a one-stop shop for application troubleshooting, as it now integrates with a number of other Java performance monitoring utilities and JVM tuning tools.
Java Mission Control's companion tool, Java Flight Recorder, is a sampling-based JVM profiler and event collection tool that is built directly into the JVM. However, Java Flight Recorder writes all of its data into a binary format that is not easily consumed by standard performance reporting tools. Java Mission Control was built to make it possible to analyze the data contained within a Flight Recorder file and subsequently display the performance metrics in a visually appealing manner.
Java Mission Control profiling
Java Mission Control presents Java application and JVM performance metrics in standard lists and tables but also in the form of the following:
- Histograms
- Pie charts
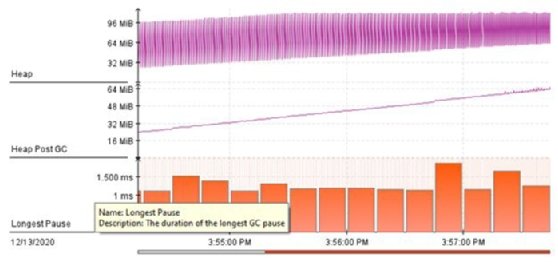
- Line art
- Flame lines
- Scatter diagrams
Developers can use Java Mission Control diagrams and charts to troubleshoot these JVM performance issues:
- Concurrent thread locks, pauses and deadlocks.
- Java Exception and Error metrics.
- Thread dump analysis.
- Concurrent Mark Sweep and G1 garbage collection pauses.
- Reclaimed and zombified code cache methods.
- Thread Local Area Buffer allocations.
- Native library access.
- CPU usage and peaks.
- Memory and heap consumption.
Automated event data analysis
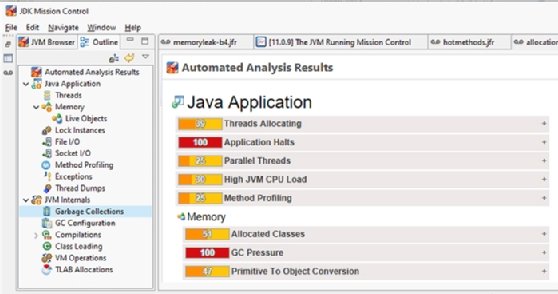
Along with its visually appealing format, Java Mission Control also has built-in AI features that perform pattern analysis on Flight Recorder files. After this analysis, Java Mission Control will inform the user if certain statistics fall outside normally acceptable ranges. This directs where a developer or DevOps professional should focus JVM tuning and Java optimization efforts.
Java Mission Control and JRockit
Java Mission Control is the result of a series of acquisitions. Both Java Mission Control and its companion tool Java Flight Recorder were created by Appeal Virtual Machines as a complement to the high-performance JRockit virtual machine. In 2008, Oracle purchased BEA WebLogic, which had acquired Appeal Virtual Machines in 2002. Oracle then integrated both Java Mission Control and Java Flight Recorder into the version 7.40 release of the JDK. The tools were released to the open source community in 2018.
Java vs. JDK Flight Recorder
While the Java Flight Recorder profiling tool is built into the JVM, Java Mission Control is packaged separately and must be downloaded from a JVM vendor, such as Azul, Eclipse Adoptium, Red Hat or Oracle.
Because Oracle owns a trademark on the Java name , third-party vendors cannot include the name in their builds of Mission Control. While Oracle continues to brand its distribution as Java Mission Control, other vendors use the term JDK Mission Control to avoid trademark infringement. JMC is commonly used as shorthand for Java Mission Control. Java Flight Recorder is often referred to as JFR. So, when looking for a Java Mission Control option, the tool will likely be called JDK Mission Control.
Real-time JVM monitoring
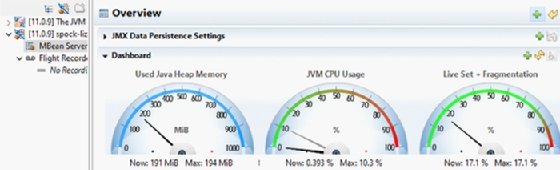
Along with the ability to analyze Flight Recorder files, Java Mission Control can also connect to running JVMs and profile those applications through the use of a managed beans (MBeans) server. MBeans exposes runtime information about active JVMs. Integration with the MBeans server allows Java Mission Control to provide live monitoring of a variety of metrics, including CPU utilization, memory consumption, metaspace usage and garbage collection.
Java Mission Control also provides embedded access to the Java Diagnostic Command tool jcmd. Developers can use it to execute a variety of VM operations against a running JVM, such as the following tasks:
- Create a memory heap dump.
- Acquire a histogram of classes on the heap.
- Inspect the JVM's String table.
- Stop and start Java Flight Recorder.
- Issue a command to start garbage collection.
- Print all JVM compiler directives.
Mission Control vs. VisualVM
The JDK comes prepackaged with a number of JVM monitoring and inspection tools, including JConsole and VisualVM. These tools are viable options for organizations not interested in the additional effort required to download and install Java Mission Control from a third-party vendor.