How to start Java's JVM Flight Recorder in 3 easy ways by example

How to start Java Flight Recorder
JDK Mission Control provides a powerful suite of tools for developers and DevOps professionals to profile their applications and monitor JVM performance. But JDK Mission Control requires data from Java Flight Recorder to do this. In this Java Flight Recorder in Eclipse tutorial, we will show you three simple ways to start a recording and view the automated analysis result.
Flight Recorder example prerequisites
This Java Flight Recorder example assumes the following prerequisites:
- JDK 11 is installed and JAVA_HOME is set
- Use of a 2020 Eclipse IDE release
- The Java Mission Control Eclipse plugin is configured
However, only one of the three examples of how to start Java Flight Recorder requires installation of the Eclipse plugin. Use of JVM arguments and the Java Diagnostic Command only require a recent Java installation.
Mission Control’s JVM browser
The easiest way to start Java Flight Recorder in Eclipse is to start a Java application and then move to the JDK Mission Control perspective. All of the running JVMs on your computer will be listed.
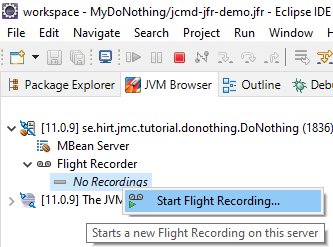
The JVM Browser view is the easiest way to start the Java Flight Recorder in Eclipse.
Simply right-click on the Flight Recorder and choose the Start Flight Recording option. A window asking when to start the flight recording and how long to record for will open. Customize the Java Recorder accordingly and then run the monitoring process. When Flight Recorder finished, the results will appear in the Java Mission Control window.
Flight Recorder JVM settings
This second way to start Java Flight Recorder in Eclipse will work even if you do not have the Java Mission Control plugin installed.
You can always start a flight recording in a Java application by simply editing the JVM arguments and adding the StartFlightRecording flag. Save these Flight Recorder JVM settings in an Eclipse launch configuration, and a recording will start every time you run the application.
In addition, when you add the following String attribute to an Eclipse launch configuration, the Flight Recorder will record the JVM for 40 seconds, starting after a 2 second delay:
<stringAttribute key="org.eclipse.jdt.launching.VM_ARGUMENTS"
value="-Djava.net.preferIPv4Stack=true
-XX:+FlightRecorder
-XX:FlightRecorderOptions=stackdepth=128
-XX:+UnlockDiagnosticVMOptions
-XX:+DebugNonSafepoints
-XX:StartFlightRecording=delay=2s,
  duration=40s,
  name=StartFlightRecorder,
  filename=${workspace_loc}/recordings/flight-recording.jfr"
/>
Flight Recorder and jcmd
The third way to start Java Flight Recorder in Eclipse is to open your Eclipse project in a DOS prompt or a BASH terminal and run the Java Diagnostics Command jcmd.
So long as the JDK’s bin directory is on the classpath, you can run the jcmd command from any directory. Without any switches, the command will list the process ID of any running JVM on your computer.
MissionControl@EXAMPLE /c/tutorial/jmc (master)
$ jcmd
15308 jdk.jcmd/sun.tools.jcmd.JCmd
1836 se.hirt.jmc.tutorial.donothing.DoNothing
With knowledge of the JVM process ID in hand, you can use jcmd to start the Flight Recorder:
MissionControl@EXAMPLE /c/tutorial/jmc (master)
$ jcmd
15308 jdk.jcmd/sun.tools.jcmd.JCmd
1836 se.hirt.jmc.tutorial.donothing.DoNothing
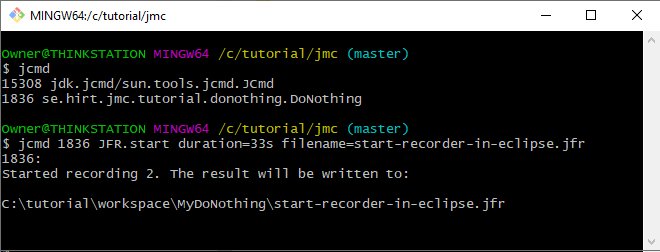
The JDK’s Diagnostic Command, jcmd, can start the Java Flight Recorder from the command line.
How to start Java Flight Recorder
In review, the three easiest ways to start the Java Flight Recorder in Eclipse are:
- Use the Java Mission Control plugin’s JVM browser view to start JVM profiling
- Create an Eclipse launch configuration file and set the StartFlightRecorder VM argument
- Use the Java Diagnostic Command jcmd to start Java Flight Recordings.
When these recordings are complete, you open them with Java Mission Control. JVM analysis and performance troubleshooting simply couldn’t be made easier.
 Cameron McKenzie is an AWS Certified AI Practitioner, Machine Learning Engineer, Solutions Architect and author of many popular books in the software development and Cloud Computing space. His growing YouTube channel training devs in Java, Spring, AI and ML has well over 30,000 subscribers.