Fix Java memory leaks without costly JVM heap dumps by example

I don’t know anyone who likes investigating a Java heap dump.
They can be massive — literally multiple gigs in size. They contain so much information that identifying the cause of a JVM memory leak can be like searching for a needle in a haystack.
Java memory leaks are easily detected by JDK Mission Control.
And the fact that inspecting a Java heap dump from a production system might have you unwittingly in possession of personally identifiable information that could, if mishandled, get you in trouble with various privacy makes the entire file feel radioactive.
I’d say inspecting a Java heap dump simply wasn’t worth the trouble, if it wasn’t for the fact that doing so is pretty much the only way to fix Java memory leaks in your JVM. Or at least it was the only way until the Java Flight Recorder introduced the Old Object Sample event.
| Your intro to GitHub Actions training course |
|---|
| Here’s how to get started with GitHub Actions:
Follow these tutorials and you’ll learn GitHub Actions fast. |
JVM heap analysis with Java Flight Recorder
Here’s how the Java Flight Recorder’s Old Object Sample event works.
When a recording is started, a fixed number of objects from the Java heap are tracked. Tracked properties of the Java heap objects include:
- Object’s allocation start time
- Object’s duration
- Associated event thread
- Last known heap size usage
- Object type
- Garbage collection root
You can adjust the number of objects on the Java heap tracked by Flight Recorder by adjusting the old object queue size:
-XX:FlightRecordingOptions=old-object-queue-size=512
JDK Mission Control memory leak detection
When a tracked object on the Java heap is garbage collected, it’s removed from the sample and a new one added. Over time, objects that have causes a memory leak are more likely to get tracked. The longer the JVM Flight Recorder runs, the more likely memory leak inducing objects are to be tracked.
Furthermore, the longer these objects that cause a Java memory leak exist, and the more memory they consume, the more glaring their existence will be when it comes time to examine the JVM Flight Recording in Java Mission Control.
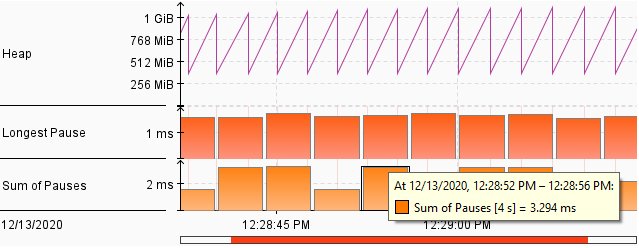
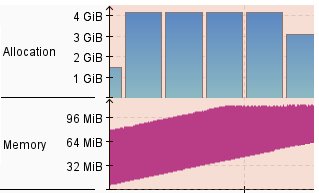
Java Mission Control shows rampant garbage collection routines hurting performance when autoboxing is used.
Furthermore, the rules engine within Java Mission Control is capable of identifying which long-running Java heap objects are most likely to be contributing to a JVM memory leak.
Notice how after a Java Flight Recorder run on a sample application designed to trigger a memory leak, Java Mission Control immediately indicates that an object monitored through the Old Object Sample event is likely the culprit:
The live set on the heap seems to increase with a speed of about 192 KiB per second during the recording.
An analysis of the reference tree found 1 leak candidates. The main candidate is java.util.Hashtable$Entry[] Referenced by this chain:
- java.util.Hashtable.table
- se.hirt.jmc.tutorial.memleak.Leak$DemoThread.table
Live Objects on the Java heap
Along with the initial automated analysis, Java Mission Control will provide a list indicating the size of all active items on the heap, along with a list of all live objects in memory. As you can see, without the need to resort to a JVM heap dump, a Java memory leak has been easily identified.
A JVM Flight Recorder run can help identify Java memory leaks without a heap dump.
Memory leak detection best practices
Obviously, the example in the memory leak detection example is a simple one. To identify offending objects in a more complicated example, follow these memory leak detection best practices:
- Run Java Flight Recorder for extended periods of time.
- This increases the change of an offending object to get sampled.
- Look at objects consuming the most memory on the JVM.
- Look at the objects consuming the most memory on the JVM.
- De-prioritize objects allocated at JVM startup. Process initialization can create a lot of noise.
- Objects allocated towards the middle of a Flight Recorder run are more likely culprits than those allocated at the beginning or end.
- Monitor daemon threads referenced externally by Java classloaders.
- Keep an eye on:
- Static variables
- Cached data
- Long running threads
- Add custom triggers to start Java Flight Recorder when certain memory consumption thresholds are met.
- Add telemetry to your Java applications by coding custom Flight Recorder events and starting them at potential problem points.
- Be proactive and monitor applications for memory issues before they become a severity 1 production problem.
JVM Flight Recorder and JDK Mission Control
JVM Flight Recorder and JDK Mission Control provide a variety of advanced features that allow developers to troubleshoot Java memory leaks without the need to inspect complicated Java heap dumps. Get familiar with these powerful profiling and monitoring tools, and troubleshooting Java performance problems will cease to be a cumbersome task.
The code used in the Java leak detection example comes from Marcus Hirt’s JMC tutorial. Find out more from Marcus Hirt’s blog.
 Cameron McKenzie is an AWS Certified AI Practitioner, Machine Learning Engineer, Solutions Architect and author of many popular books in the software development and Cloud Computing space. His growing YouTube channel training devs in Java, Spring, AI and ML has well over 30,000 subscribers.