
Use this Java performance tuning guide to optimize your JVM
There are two steps to Java performance tuning. First, assess your system to make sure it can improve. Then, optimize shared resources like CPU and memory.

Software development is fun.
Troubleshooting live applications when they fail to meet nonfunctional requirements, such as performance, throughput and response times? That's not fun. Which is why every DevOps team should have a stated Java performance optimization strategy to help identify and troubleshoot JVM performance problems.
Before you can say you have a Java performance problem, however, you must first verify that you are not expecting your application to perform beyond the system's maximum capacity. What type of performance is actually achievable on your current hardware? If your JVM performance target exceeds the capabilities of your underlying servers, Java code optimizations will be of no benefit.
System capacity benchmarks
It's unlikely that developers would know the exact performance capabilities of the server upon which their application is hosted. But you can usually find published benchmarks for a system similar to the one you use in production.
TCP.org is a handy site for finding established benchmarks for modern enterprise servers that run in a highly transactional environment. For example, TCP.org benchmarks a modern Lenovo ThinkSystem SR650 containing 56 cores and 112 threads as being capable of handling nearly 7,000 transactions per second. And a 12-year-old IBM System x3850 with eight cores and 32 processors can brag about 800 transactions per second.
Figure out where in that range your own servers fall, and see how close your production systems are to meeting an established performance benchmark. If your application performs below an established benchmark, Java performance optimizations are possible. Still, just because it's possible to optimize doesn't necessarily mean you should.
JVM performance targets
The trigger for investing time in Java performance optimization is not whether you are squeezing the most out of every clock-cycle's tick. Instead, look at whether you are able to meet performance targets.
DevOps teams shouldn't invest time in squeezing the most out of every clock-cycle tick. You should only invest in Java performance optimization when your current performance targets are not met.
Every application should have clearly stated performance benchmarks. What is the longest acceptable response time? How many transactions per second should be processed? What is the maximum throughput an application must be able to handle?
Well-stated, quantitative targets should be established for:
- latency
- throughput
- responsiveness
- stability
- jitteryness
An application's performance manifesto might include statements like the following:
- The application will support 500 transactions per second.
- Page load times will be less than two seconds.
- Failover occurs in less than five seconds.
- 99% of transactions happen in less than 40 milliseconds (ms).
- Stateless response times will average 50 ms.
- Stateful response times will average 500 ms.
- Java CPU usage will not exceed 50% utilization for more than two consecutive minutes.
If your application performs below the established benchmarks for your system, and your performance benchmarks are in jeopardy of being breached, you can begin the investigation into how to optimize Java performance.
Learn more about Java Flight Recorder and Java Mission Control.
Java performance optimization guide
Most Java performance problems can be attributed to one of the following four shared resources:
- CPU
- memory
- I/O operations
- threads
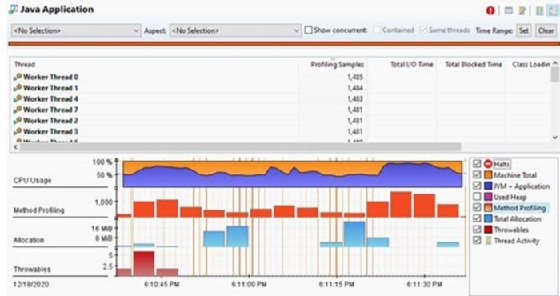
A Java profiler such as Java Flight Recorder can help immediately identify the bottleneck in your application. Use Java Mission Control to investigate a flight recording with special attention to the following metrics:
- CPU utilization
- system context switching
- physical memory utilization
- heap consumption over time
- network bandwidth used
- disk I/O latency
- database locks
- SQL latency
- garbage collection frequency
- garbage collection pause time
- thread contentions
- thread pauses
- thread locks
Java performance optimization targets
Once you know which shared resource causes the JVM performance problem, examine stack traces to identify the active Java classes and methods when the performance problem occurs. Eighty percent of the time, Java performance optimization is achieved when you:
- use faster database queries;
- identify and fix memory leaks;
- optimize garbage collection routines;
- resolve thread locks and concurrency issues;
- fix inefficient code in the application; and
- use the correct collection class for list processing.
Once you have identified the software component responsible for performance degradation, it's up to the development team to prioritize the task of Java code optimization.
Code changes, bug fixes, iterative updates and performance test routines will eventually lead to a performance patch that will fix the bottleneck, optimize the application and bring JVM performance back in line with your organization's stated targets.
Addressing performance problems is never a fun task. But, with an effective Java performance optimization guide in place that pays heed to what is possible, what the performance targets are and an eye on how to identify bottlenecks when they arise, the job of Java performance optimization becomes much easier.
Note: Much of what I've learned about Java performance tuning and optimization has come from attended lectures by Kirk Pepperdine and Jack Shirazi. Many of the ideas discussed can be attributed to these two Java performance experts.