Fotolia
How do Java sampling and JVM instrumentation differ?
These two approaches both aim to improve Java performance and can be done together. But there is a fundamental difference between instrumentation and sampling.

Java performance, profiling and monitoring tools can take one of two approaches to acquiring information about the applications they inspect:
- Java sampling
- Java instrumentation
There is some overlap -- but they're fundamentally different. Java instrumentation will track each and every instance of a given metric. This can create performance issues. Java sampling involves tracking just a sample of metrics, so it's a lighter load on your application, but not every event will be captured.
With Java instrumentation, software architects add additional code or software components either to the underlying JVM or into the code of an application running on the server. They add these instruments into spots they believe are likely to be sources of performance problems. Instruments that track object creation, disk latency or the length of time required for a JDBC query to complete are commonplace.
Because instruments are inserted into application code or embedded within the JVM, they get triggered every time they are encountered. If used in an area of high utilization, Java instrumentation can generate a great deal of data and hinder performance. Because of this possibility, instrumentation must be employed judiciously.
Java sampling vs. instrumentation
In contrast to instrumentation, Java sampling does not record and generate an event for every action that occurs on the JVM. Instead, Java sampling tools, such as Java Flight Recorder, randomly query various counters and metrics that are already tracked by the system. Unlike Java instrumentation, sampling does not target every event that occurs on the JVM. A Java sampling profiler will not take note of every single Java object that causes memory leaks, or track the time it takes to perform every primitive-type autoboxing operation. Instead, only a small percentage of the operations being performed by a JVM or Java application will be witnessed and recorded.
Learn more about Java Flight Recorder and Java Mission Control
The key benefit to Java sampling versus JVM instrumentation is the fact that sampling has a much smaller, and a much more predictable, performance impact. The drawback to Java sampling is that important events may be missed, especially when the time allocated to profile the JVM is relatively short.
Java instrumentation API
To ensure Java instrumentation is done properly, the JDK provides a custom Java instrumentation API that allows JVM agents to be easily turned on and off, while keeping the instrumentation code outside of the application code. Historically, Java developers who have tried to write their own instrumentation code have done so poorly, which causes more problems than the JVM instrumentation code promised to solve. The Java instrumentation API helps to enforce programming best practices and helps developers avoid common pitfalls.
Java instrumentation and sampling tools
Java Flight Recorder is the de facto Java sampling tool, having been built directly into the JVM since the Java 8 LTS release. Incredibly efficient, the default configuration of Flight Recorder consumes less than 1% of an application server's resources.
For Java instrumentation, platforms such as VisualVM, JConsole and a managed bean (MBean) server make it possible to read and aggregate event data provided through JVM instrumentation feeds.
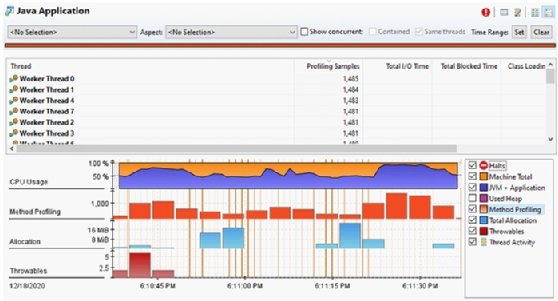
Java Mission Control, a tool originally developed for the JRockit JVM, combines the ability to visually display the results from a Java sampling tool such as Java Flight Recorder and the ability to report instrumentation-based metrics from an MBean server. The benefit of the MBean server is its ability to report on real-time metrics from an application server such as Tomcat or Jetty, although real-time streaming of JFR data has recently been added to the JDK.
Both Java sampling and JVM instrumentation play an important role in application monitoring and performance optimization. A best practice is for a DevOps team to combine both approaches when they optimize and tune their JVMs and use a visualization tool such as Java Mission Control or VisualVM that can aggregate data from both.